Vistrail provides you with the opportunity to see what your customers are really doing whilst on your site. It will give you insights as to why people are not checking out, buying products or following links, or why they are missing your best selling points.
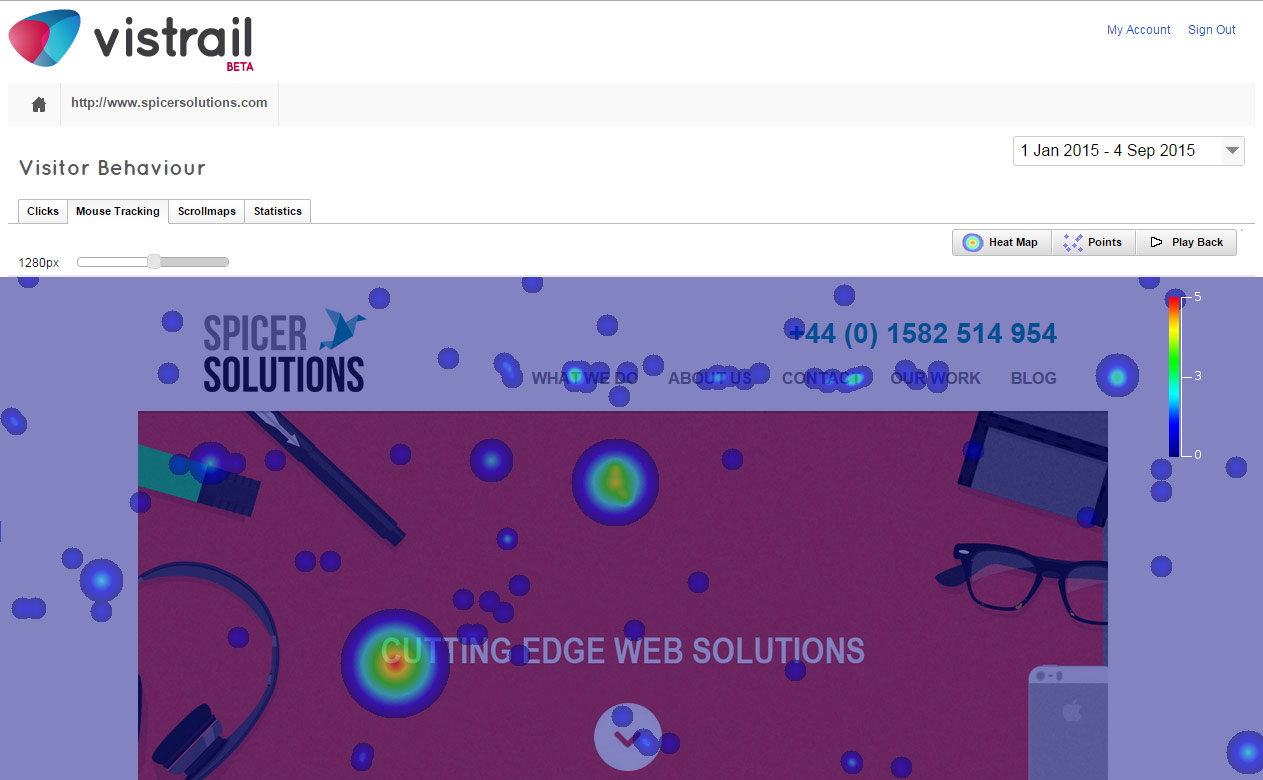
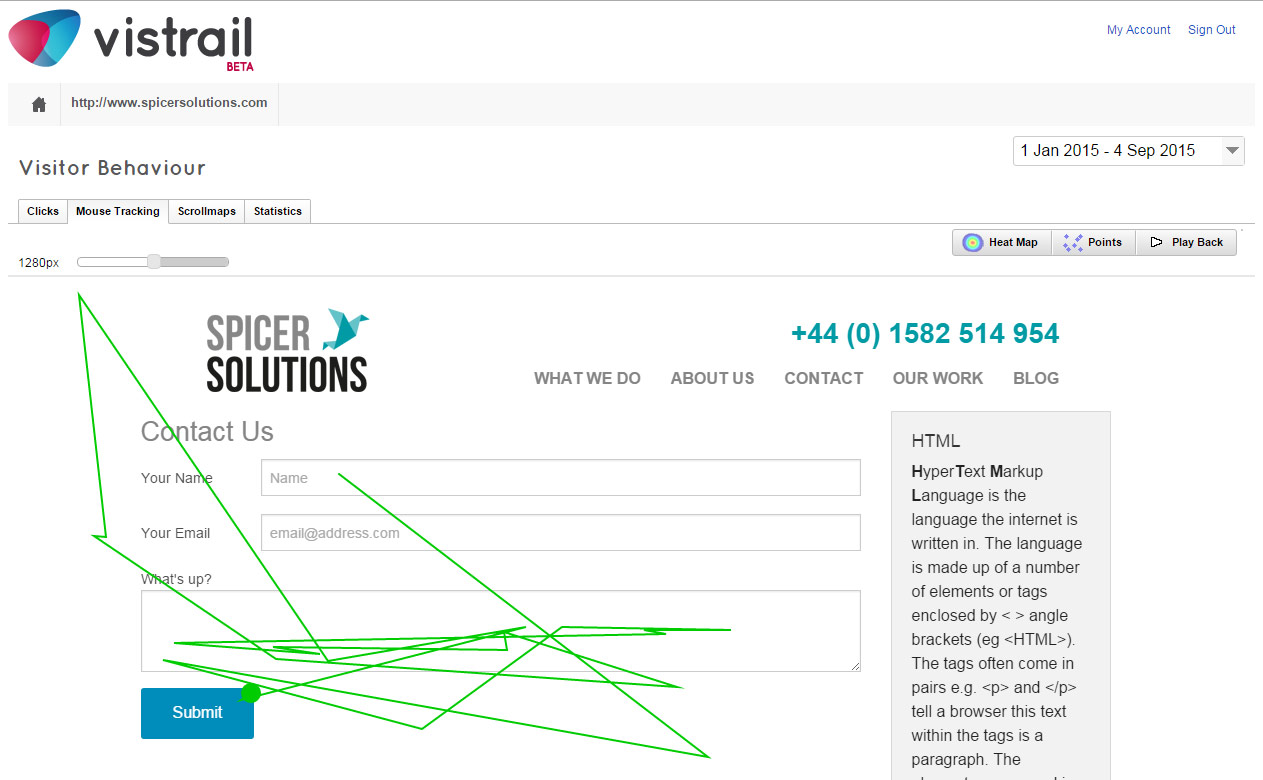
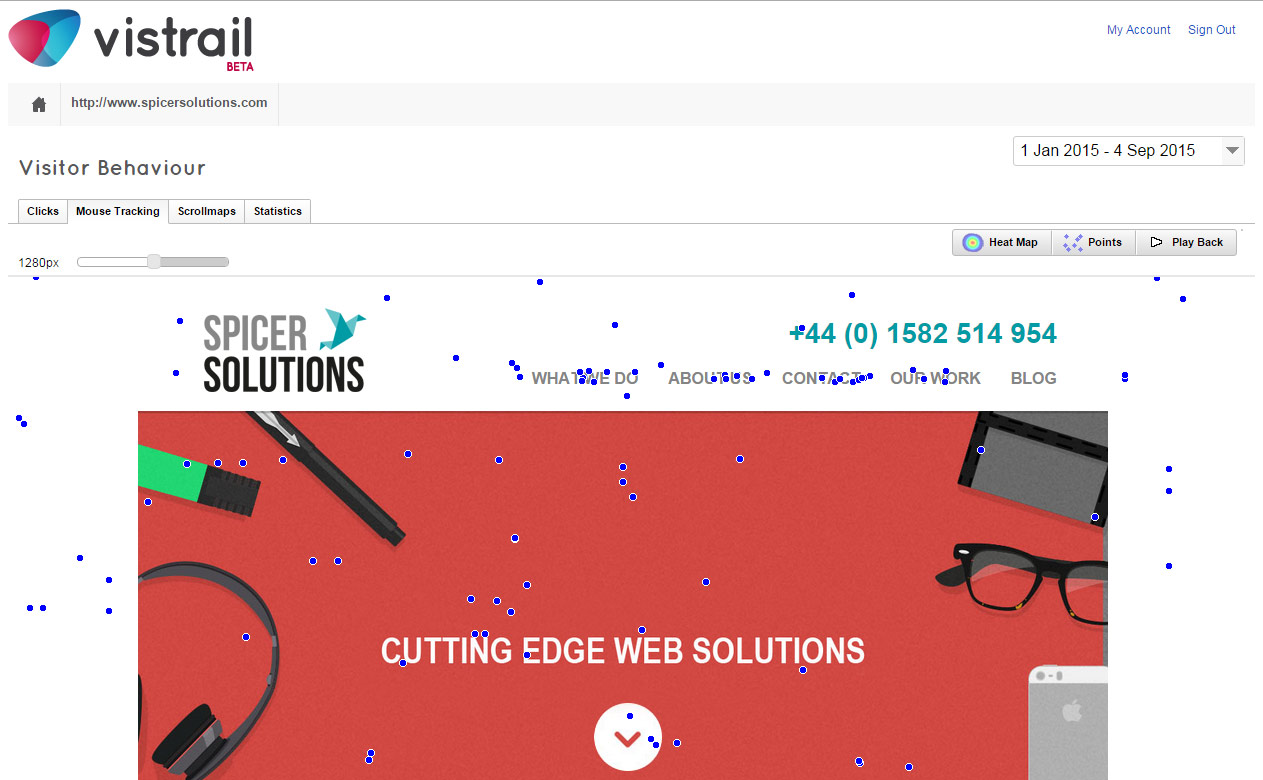
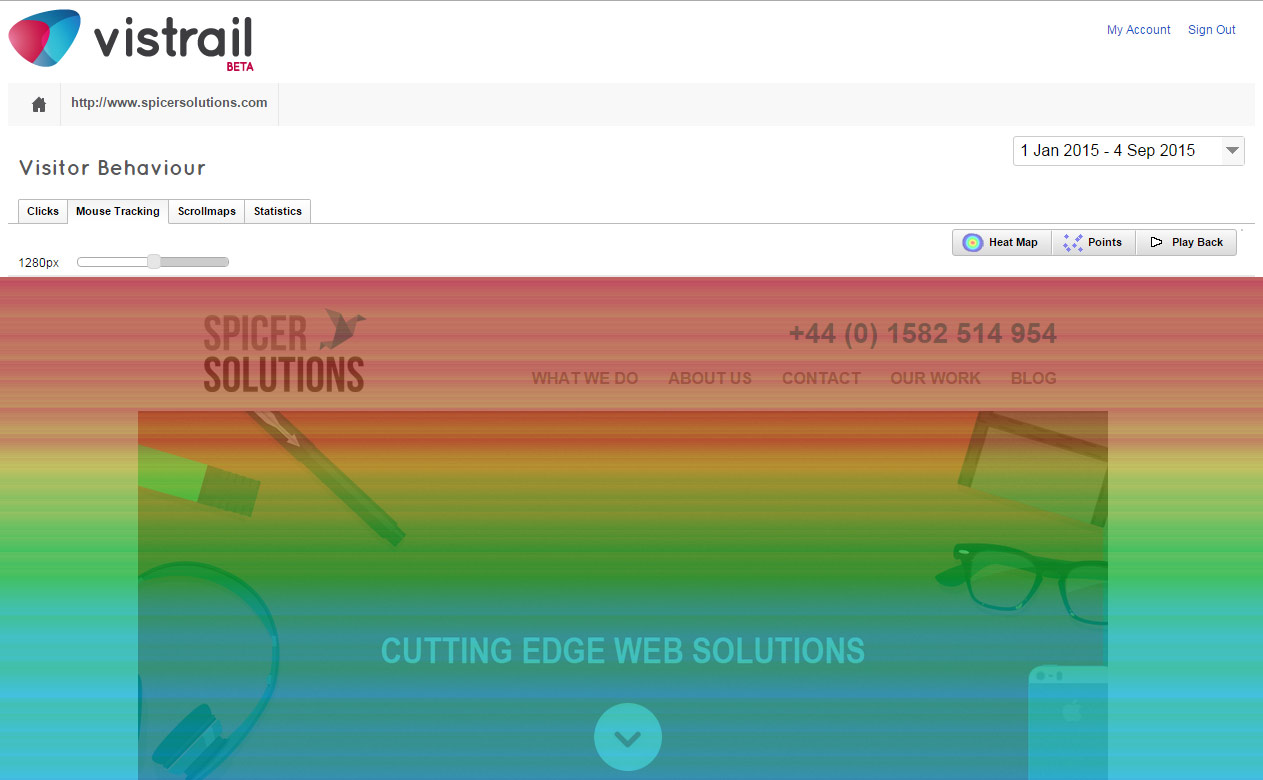
How does Vistrail work? Using cutting edge technologies we can visualise the parts of a page that people visit and identify where people click. To visualise a customer’s progress the system can draw heatmaps, plot individual points or produce a playback of a person’s mouse movements.
Vistrail provides four methods of visualising information about how customers use your site.
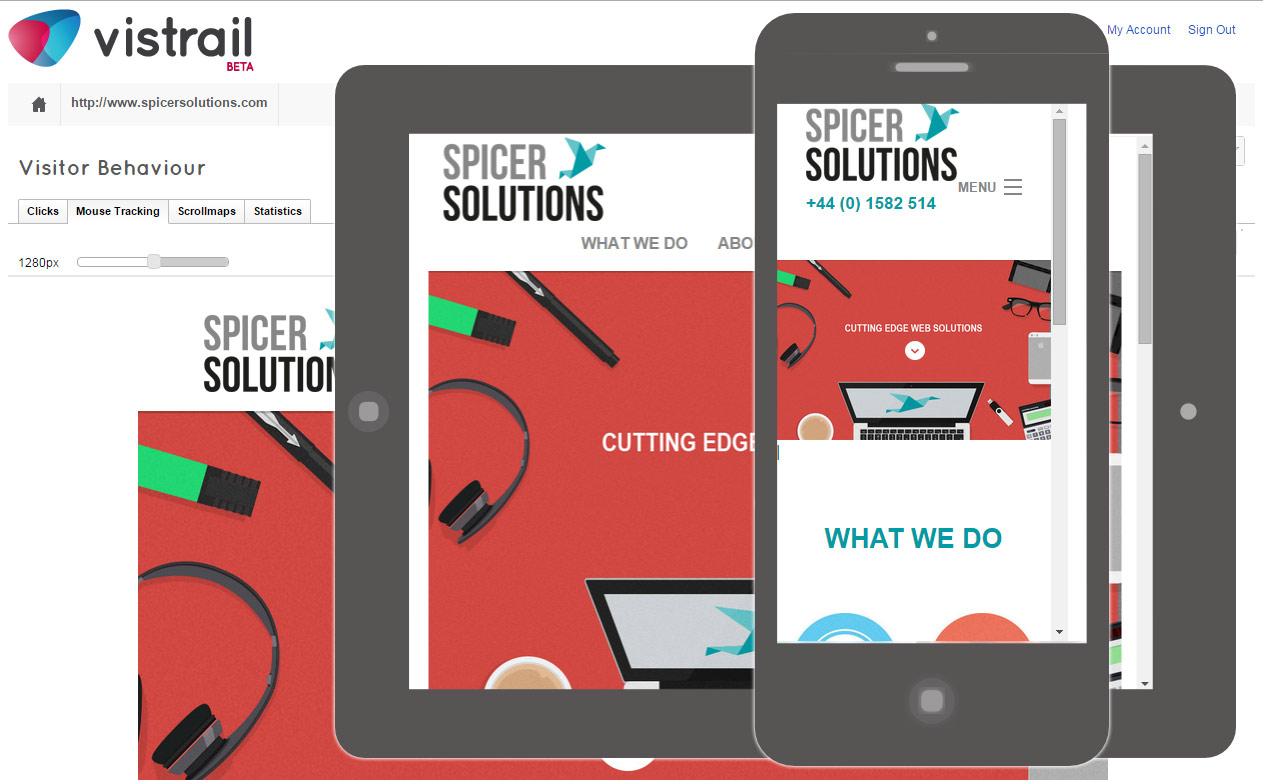
As more and more people are using tablets and mobile devices we’ve included the ability to display your site as it would on their device. When viewing in this mode we’ll only retrieve the data points that correspond with the right size. This way you’ll be able to see how easily your visitors can use your responsive site.
The scrollmap allows you to see how far down the page people are getting. This is great for identifying why some things are not being seen or used. Do people scroll far enough? Should you be placing particular items further up the page?
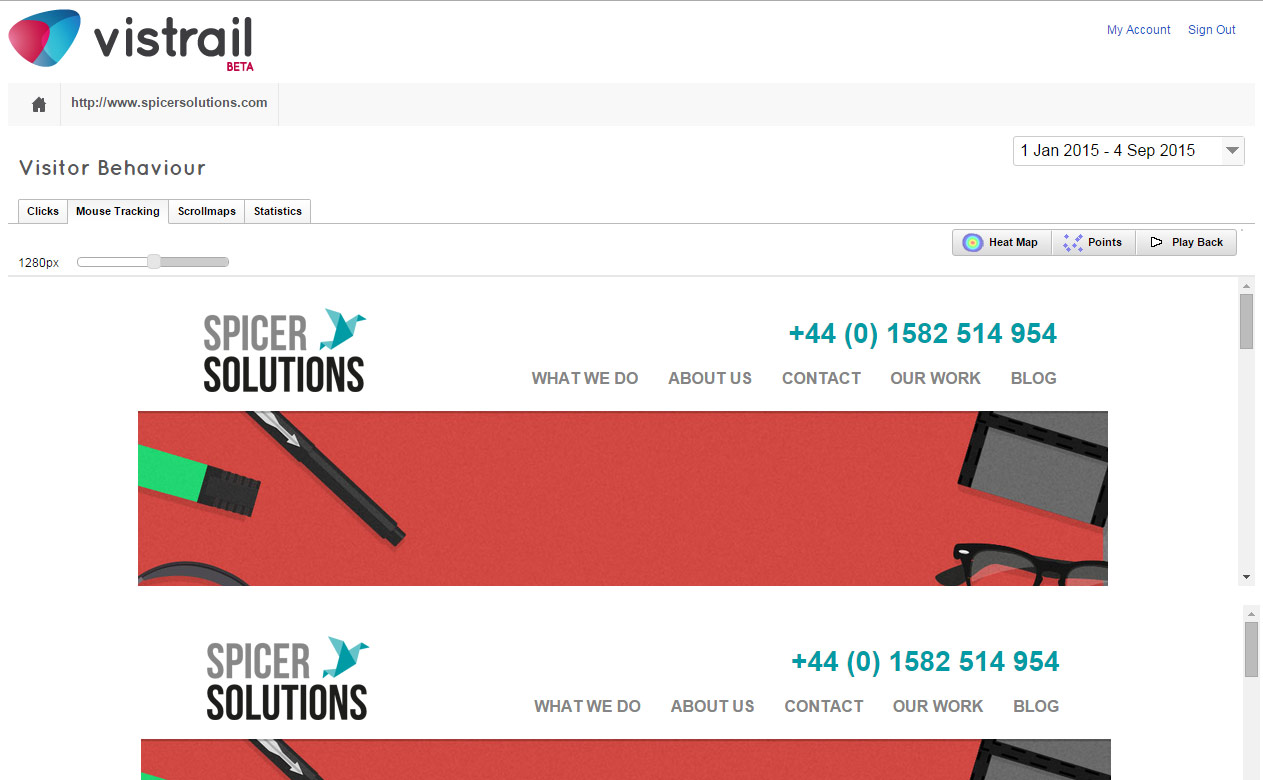
One of Vistrail’s great features is that you can compare collected data. Using a split screen you can make a direct comparison between the clicks over two time periods. You can really see how the changes you’re making affect your customers and how they use your site.
Vistrail utilises HTML 5 and CSS 3 to achieve its goals. If you’re not running an up-to-date version of Chrome, Firefox, Safari, Opera or IE10, now would be a great time to download one.